The Owner's Cockpit: Building a One-Screen Business Dashboard With AI
Build an AI business dashboard from the questions you ask every week: cash, backlog, jobs and people on one screen, and where each number lives.
In this article
- What the two retreat sessions covered
- Start with your weekly questions, not a KPI list
- What goes on an AI business dashboard for owners?
- Where the data comes from: QuickBooks, ERP, CRM and spreadsheets
- Keep it safe and keep it honest
- AI business dashboards by industry
- Frequently asked questions
- See the AI dashboard for your industry
An AI business dashboard is one live screen that answers the questions you ask every week: how much cash do we have, how much signed work is waiting, which jobs are in trouble, and who is overloaded. It pulls those answers from QuickBooks, your job or practice system, and the spreadsheets in between, so nobody re-keys numbers into a Friday report. To build one, write your weekly questions down first, connect the systems that already hold the answers, and let AI turn plain-English questions into charts and short written reports.
That approach ran through two sessions at the AI Business Retreat on September 15, 2026, at The Island in Spooner, Wisconsin. Here is what they covered, and how to build the same kind of owner dashboard on your own data.
What the two retreat sessions covered#
The Owner's Cockpit: every number that matters, one screen#
The Owner's Cockpit was Rene Miller's Leadership Track workshop. Rene is a Certified AIBMM Executive Coach and the CEO and co-founder of Ener Systems. The session was built for owners and CEOs who ask the same questions every week about cash, backlog, jobs and people, and then wait for someone to assemble the answers.
Its outline had three parts:
- Turning the weekly questions you already ask into live metrics.
- The four panes that matter to an owner: cash, backlog, jobs and people.
- Reading the whole screen in 5 minutes each morning.
The session's stated takeaway is a cockpit spec: the exact metrics you would wire first. That spec matters more than any software choice, because only the owner can write it.
Working lunch: a business dashboard built from raw exports#
The working lunch live dashboard build was taught by Tim Holum (software developer and co-founder of Coulee Tech, and the retreat's Builder Track instructor) and Greg Brainerd (Certified AIBMM Coach, and founder and CEO of Braintek). The session walks through building a live operational dashboard from scratch out of QuickBooks-style ledger exports, a job system and spreadsheets.
Its outline also had three parts: raw exports to live metrics in under an hour, the five weekly questions every owner asks answered on one screen, and what this replaces. That last part is the Friday re-keying ritual, where someone copies numbers out of QuickBooks, a job system and a few spreadsheets into a report that is stale by Monday. The takeaway matched the cockpit session: a list of the weekly questions you would wire up first.
Start with your weekly questions, not a KPI list#
Most advice on building a small business KPI dashboard starts with a long list of metrics. For an owner, that is backwards. A metric you never ask about is clutter, and a cluttered screen is an easy one to stop opening.
Start here instead:
- Collect last month's questions. Scroll back through texts and emails to your bookkeeper, office manager and project leads. Every "where are we on..." is a candidate.
- Keep the weekly ones. A question you ask once a quarter belongs in a quarterly report, not on the cockpit.
- Name the source and the person. For each question, write down which system holds the answer and who pulls it together today. The second column is the time you are about to get back.
- Write the trigger. Decide what number would make you act. "Cash below 2 weeks of payroll" is a trigger. "Cash" is not.
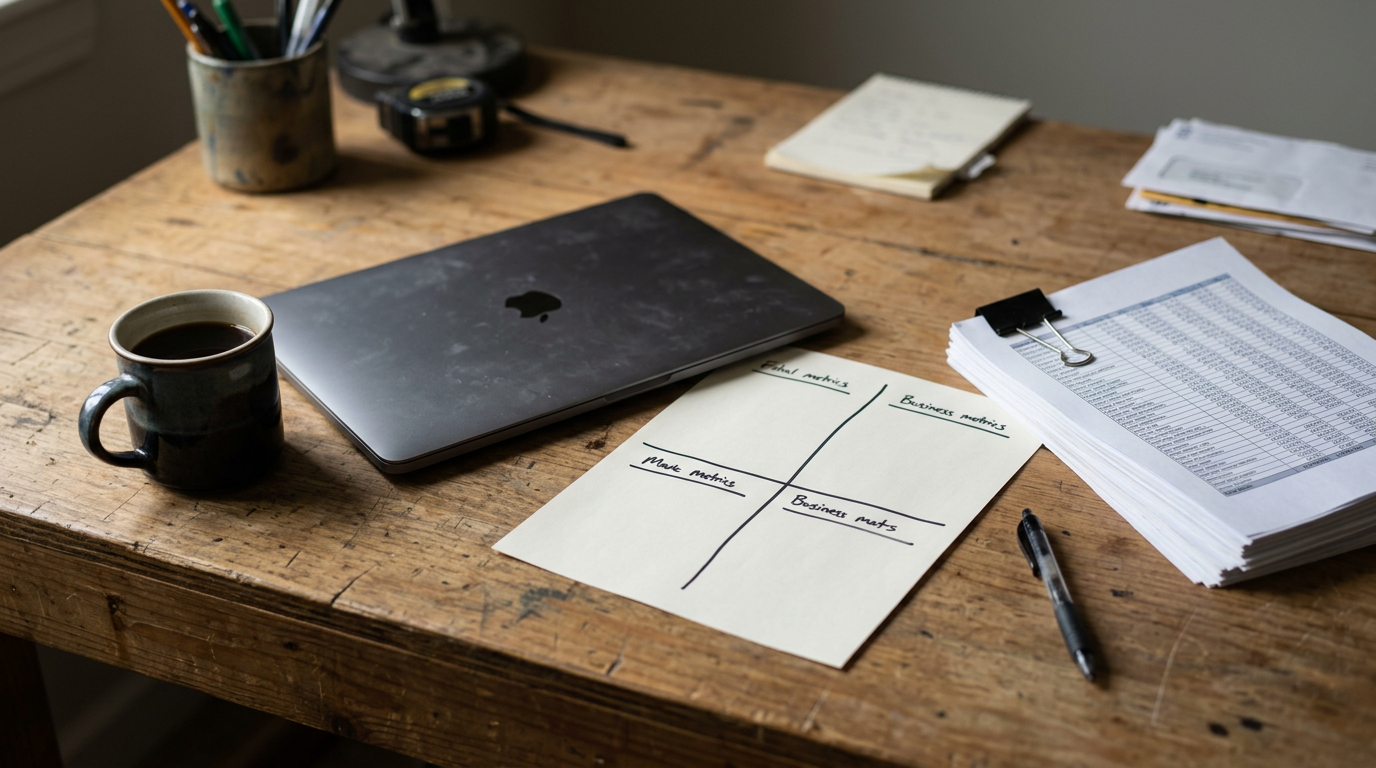
- Sort into four panes. Cash, backlog, jobs, people. If a question fits none of them, ask whether you really need it every morning.
The result is your cockpit spec. Keep it to one page. It doubles as the requirements document for whoever builds the dashboard, whether that is you, your team or an outside partner.
What goes on an AI business dashboard for owners?#
Here is how the four panes usually break down for a business with 10 to 100 people that runs on QuickBooks plus a job or practice system. Adjust the wording to your trade.
- Cash. The question: how much cash do we have, and who owes us money past 30 days? The answer usually lives in QuickBooks: bank balances, receivables aging and bills coming due.
- Backlog. The question: how much signed work have we not delivered yet, and is that number growing or shrinking? The answer lives in your job system, ERP or CRM: signed orders, won quotes, open engagements.
- Jobs. The question: which jobs are over budget or behind schedule? The answer lives in job costing inside your ERP or job system, plus timesheets.
- People. The question: who is overloaded, who has room, and how many hours are billable this week? The answer lives in time tracking, payroll and, often, a scheduling spreadsheet.
How to make it readable in 5 minutes#
- One headline number per pane, with its trend beside it.
- A short exception list under each number: the three overdue invoices, the two jobs over budget.
- Color only where action is needed. If everything is red, nothing stands out.
- The same layout every day, so your eye goes straight to what changed.
Where the data comes from: QuickBooks, ERP, CRM and spreadsheets#
A live business dashboard for an owner usually draws on four kinds of source.
QuickBooks or your accounting system. Cash, receivables, payables, profit and loss. This is usually your cleanest data, because your bookkeeper and accountant keep it reconciled.
Your ERP or job system. Backlog, job costing, work in progress and scheduling. For a manufacturer that means the ERP and shop-floor systems; for a contractor or field service company, the job management software. Backlog and job status live here, which is why an accounting-only dashboard tells half the story.
Your CRM or practice management system. Pipeline, quotes out, open matters or engagements, billable time. Law and accounting firms often keep most of this in practice management software.
The spreadsheets in between. The schedule, the estimating sheet, the list of who is on which crew. A few habits make them usable: one table per tab, one header row, no merged cells, and the same customer and job names you use in QuickBooks.
The last habit matters most. Our guide from database to dashboard with AI makes the same point: the data needs to be reasonably clean, and customer records need to match across systems. Otherwise the dashboard counts one customer as two.
Where AI actually changes the work#
AI changes two things. First, you ask in plain English ("which jobs are more than 10% over budget?") instead of filing a report request and waiting. Second, you can ask the follow-up question without anyone writing new code. Our RapidDashboard service works this way: it turns plain-language prompts into live dashboards and reports from a business's own systems.
The traditional route is a business intelligence project: a data warehouse, nightly data loads, BI licenses and an analyst to keep it running. That can make sense for a large company. For an owner who wants four panes and a morning habit, it is usually more project than the problem needs.
Keep it safe and keep it honest#
Connecting AI to your financial data deserves the same care as handing a new employee a key.
- Ask for read-only access. The dashboard needs to read QuickBooks, not post journal entries. NIST's security glossary calls this least privilege (opens in a new tab): each user or process gets only the minimum access it needs for its assigned tasks. If a system cannot grant a connection read-only rights, ask whoever builds the dashboard to show you that it only reads.
- Check it against reports you trust. For the first few weeks, compare the cockpit's cash and receivables numbers against the reports your bookkeeper already produces. Once they match week after week, you can stop checking daily.
- Give every number an owner. If the jobs pane shows a problem, one specific person should know it is theirs to explain.
AI business dashboards by industry#
The four panes stay the same from trade to trade. The systems and the specific questions change.
- Professional services. Utilization, realization, unbilled work in progress, receivables aging and pipeline. Our AI dashboard for professional services firms connects practice management, CRM, billing and QuickBooks data.
- Manufacturing. OEE by production line, job costing and budget alerts, scrap rate and capacity. The AI dashboard for manufacturers lists the ERP and shop-floor systems it works with.
- Accounting firms. Return status by preparer, e-file rejections, billable hours and realization rate, and deadline exposure during tax season. See the AI dashboard for accounting and CPA firms.
- Law firms. Utilization, receivables aging, document deadlines and pipeline, drawn from practice management tools like Clio. See the AI dashboard for law firms.
Frequently asked questions#
What should be on a small business KPI dashboard?#
Start with the questions you ask every week, then group them. For most owners they fall into four areas: cash, backlog, jobs and people. One headline number and a short exception list per area is enough. Anything you look at less than weekly belongs in a monthly report.
Can QuickBooks build a dashboard on its own?#
Partly. As of September 2026, Intuit's AI features page (opens in a new tab) lists dashboards you can customize with your own KPIs on the QuickBooks Online Advanced plan, plus an AI Chat feature marked beta and limited capacity. That covers the numbers that live in QuickBooks. An owner's cockpit usually also needs backlog, job status and people data from other systems.
Do I need a data warehouse to build an AI business dashboard?#
Usually not, for a small or mid-size business. AI tools can connect to the systems you already use, as long as those systems have an API or an export path, and answer plain-English questions from that data. What you do need is reasonably clean data, matching customer and job names across systems, and someone who checks the first few weeks of output.
Is it safe to connect AI to my accounting data?#
It can be, if you set it up the way you would for a new hire. Ask for read-only access wherever the system offers it, limit each connection to the data it needs, and know where the data is stored. Treat it as a security decision, not just a software purchase.
How is an AI dashboard different from a regular dashboard?#
A regular dashboard shows the charts someone built in advance. An AI dashboard also lets you ask a new question in plain English and get a chart or a short written answer back, without a new report request. The panes you check every morning stay fixed while the questions around them change.
See the AI dashboard for your industry#
If you still run the business from spreadsheets and a Friday report, write your weekly questions down this week. Then open the AI dashboard page for professional services, or the manufacturing, accounting or legal page above, to see the systems it connects to, sample dashboards, and a link to book 15 minutes to talk through your own numbers.